

TWINPORTS
PROJECT REFERENCE C-4.06
PORTS 4.0 COMMERCIAL-PHASE PROJECTS PROGRAMME
This project has been made possible thanks to the support of the Ports 4.0 Fund, the open innovation model of Puertos del Estado and the Spanish Port Authorities.
Year: 2025–2027
Location: Port of Vigo, Spain
Project partners: BIM6D and Kaleido Technology Solutions
Port operator: Kaleido Logistics
With the support of the Port Authority of Vigo
PROJECT OVERVIEW
INTRODUCTION
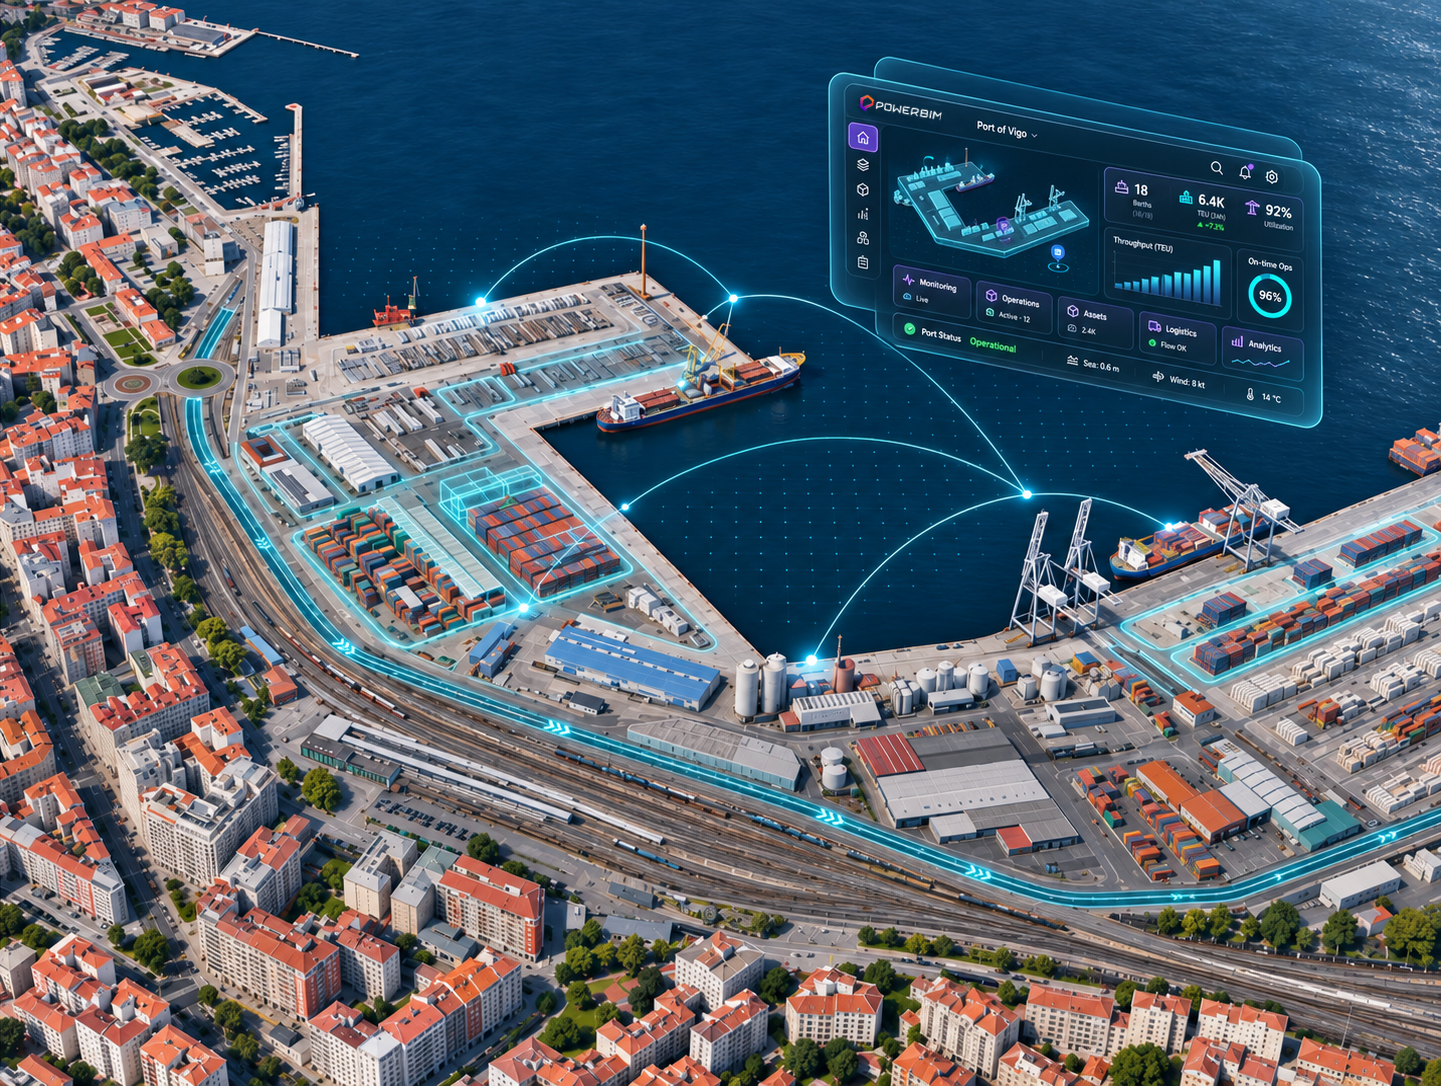
The Port of Vigo is a strategic infrastructure on Spain’s Atlantic coast, with significant commercial, fishing and logistics activity. Its port service area covers approximately 2.57 million square metres of land, reflecting the scale and complexity of the operations carried out in this environment.
At the terminal operated by Kaleido Logistics, BIM6D is developing TWINPORTS in collaboration with Kaleido Technology Solutions, with the support of the Port Authority of Vigo. The project addresses a specific operational challenge: knowing which materials are stored, where they are located and how their distribution changes over time.
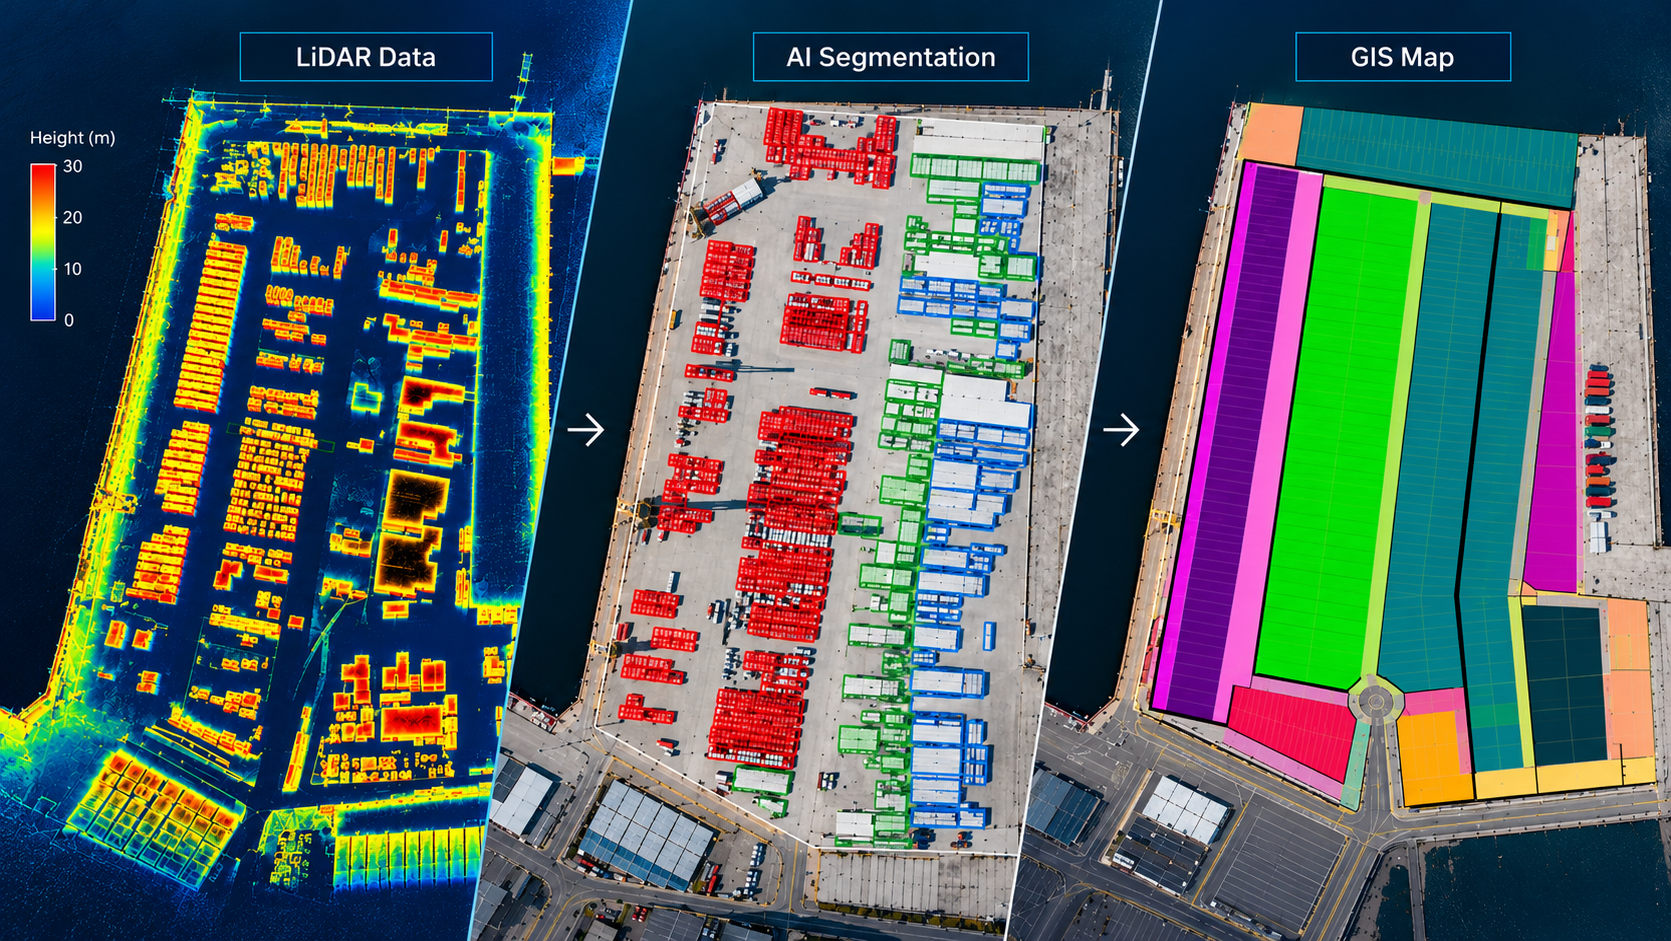
TWINPORTS combines reality capture through aerial imagery and LiDAR data with artificial intelligence and geospatial information to create a digital representation of the port environment.
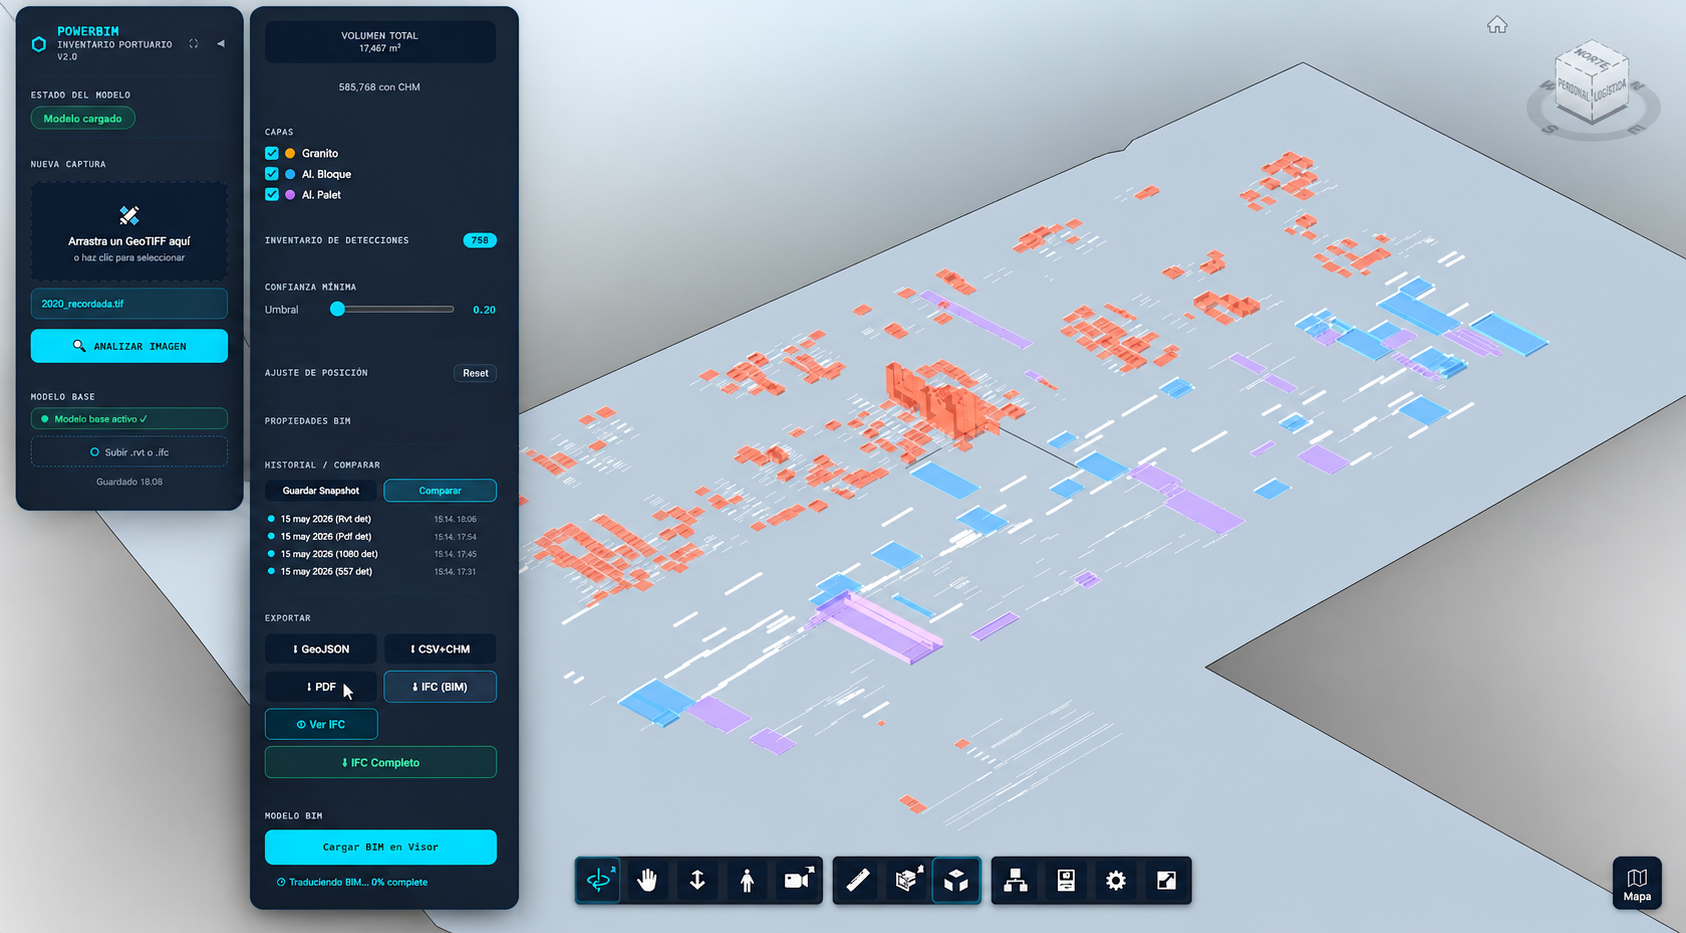
Integrated into POWERBIM, this information enables teams to review detections, identify anomalies, update records and compare changes over time, providing a more accurate and traceable view of port materials and operations.
FROM THE PORT ENVIRONMENT TO THE DIGITAL TWIN
CAPTURE AND INTERPRETATION OF THE PORT OF VIGO
TWINPORTS begins with the capture of the port environment using aerial imagery and LiDAR data. The information collected makes it possible to identify and locate materials, while artificial intelligence helps classify them and LiDAR provides information on their height, volume and position.
FROM PORT DATA TO OPERATIONAL CONTROL
CAPTURE AND INTERPRETATION OF THE PORT OF VIGO
As port information is integrated and updated, TWINPORTS makes it possible to move from a static view to an operational understanding of what is happening.
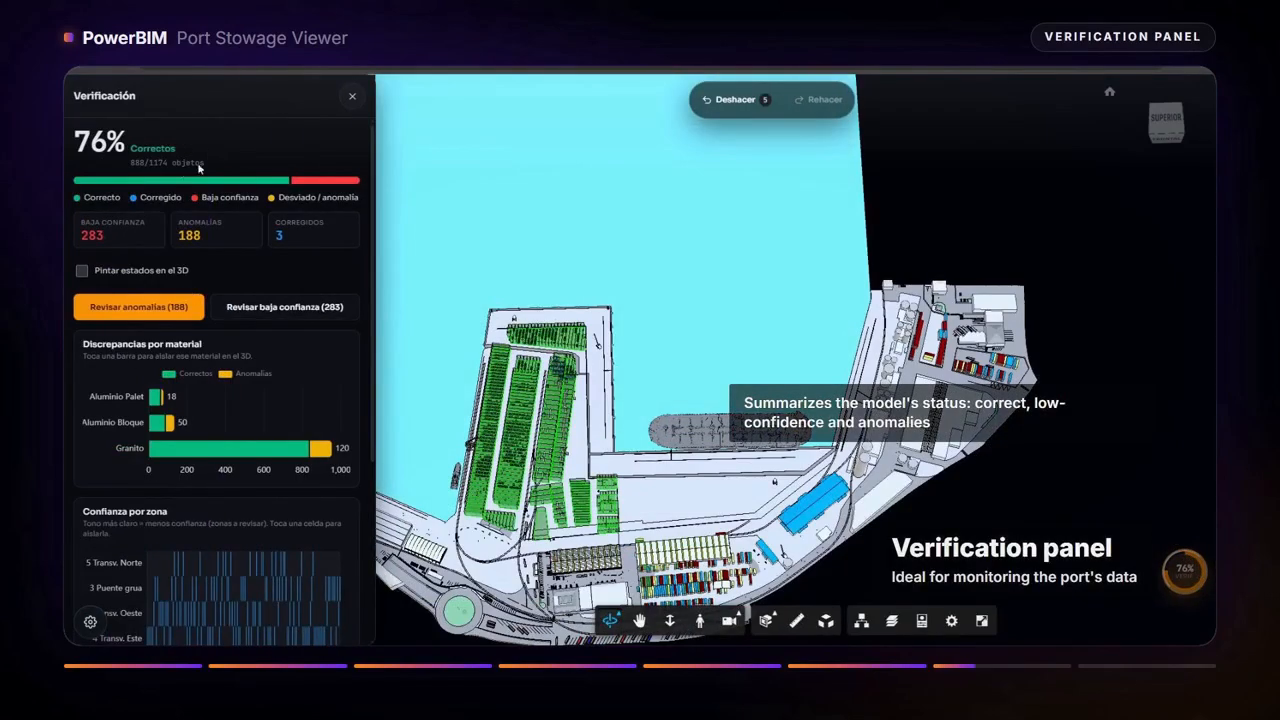
Through POWERBIM, teams can review detections, identify anomalies, update information, and compare versions to understand how the port environment evolves over time.
The result is a more traceable and contextualized view of operations, helping teams stay in control and make better-informed decisions.
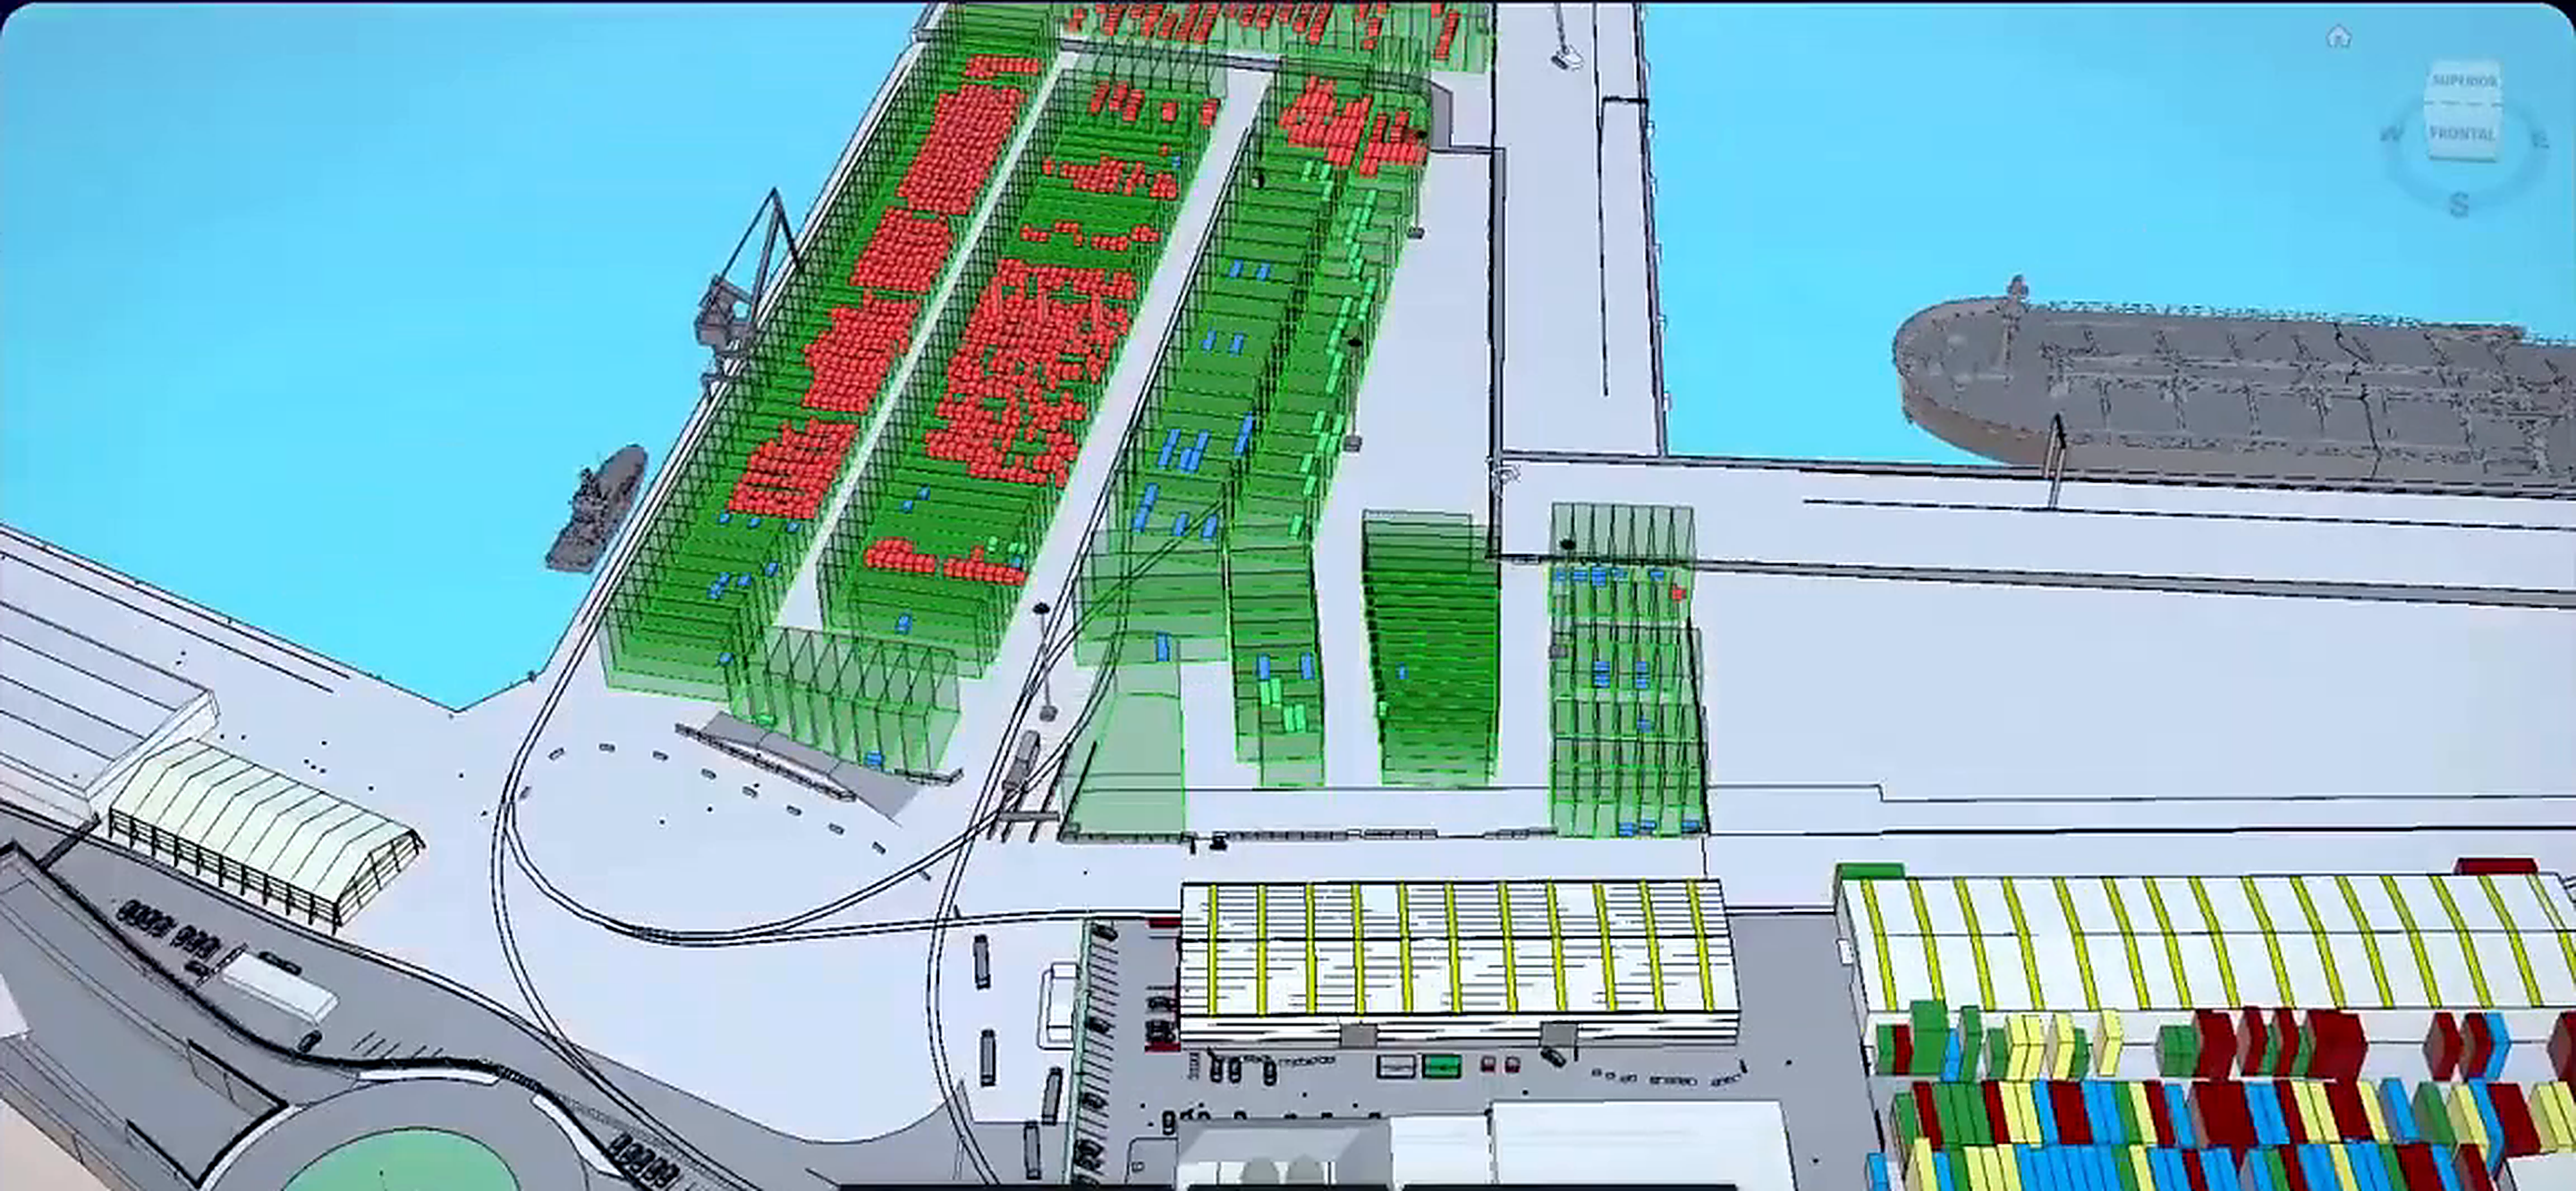
Integration and control with POWERBIM
The data collected is integrated into POWERBIM, the digital twin platform used in the project. Within this environment, teams can review detections, identify anomalies, update information, verify the model’s current state and compare how it evolves over time.
CONNECTED TECHNOLOGIES FOR PORT OPERATIONS
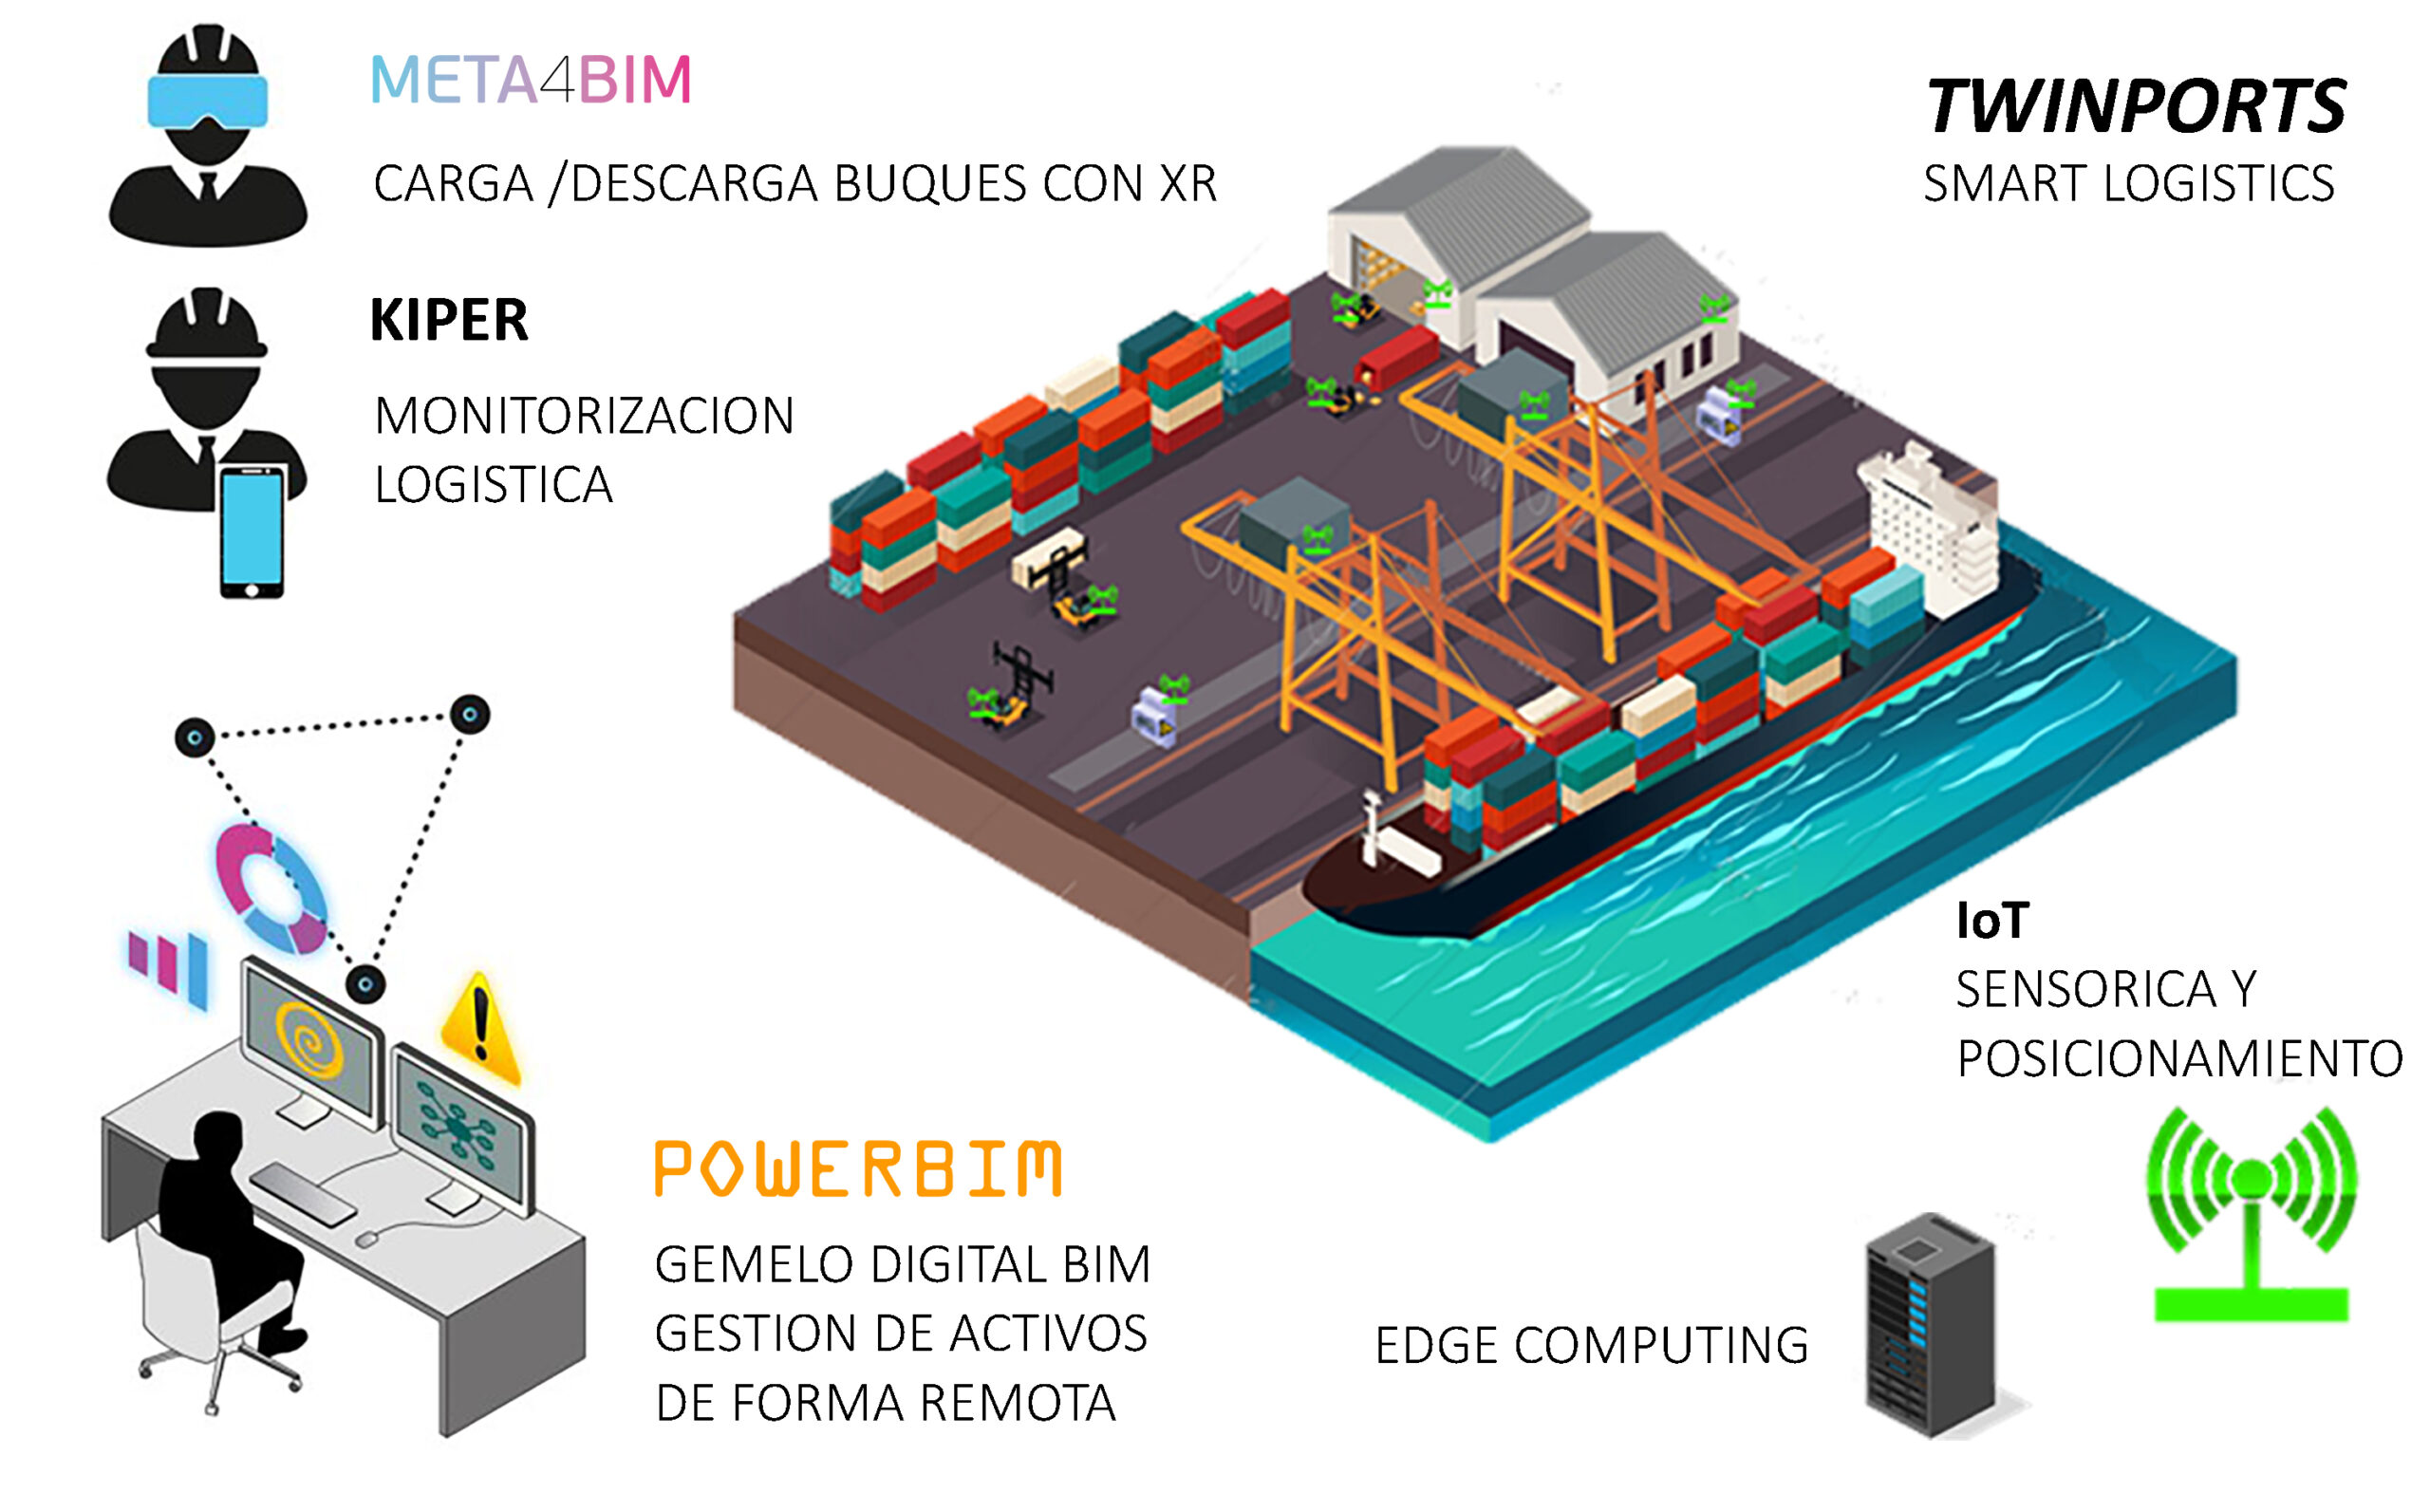
TWINPORTS combines different technologies to connect the port’s physical activity with its digital representation and management.
The project integrates IoT sensing and positioning, edge computing, logistics monitoring through KIPER, XR solutions with META4BIM, and POWERBIM as the digital twin platform used to centralize and manage information from the port environment.
This combination connects capture, positioning, monitoring, and management within a single technology ecosystem focused on port operations.
FROM DATA TO OPERATIONAL INSIGHT
TWINPORTS turns data captured from the port environment into structured and contextualized information that can be reviewed, updated and compared over time.
This provides teams with a clearer understanding of what is happening across the port and supports more informed operational decisions.
Project Workflow
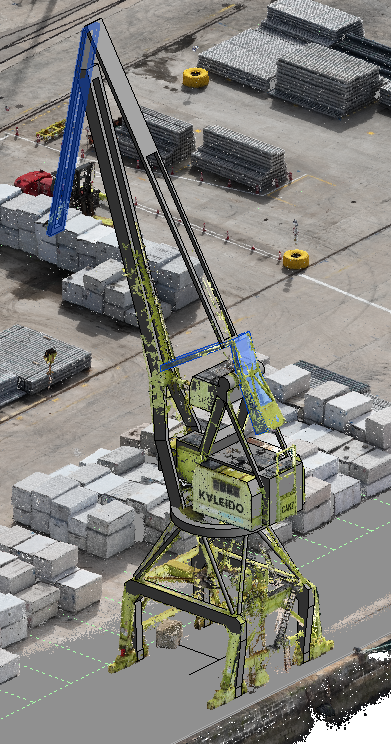
Reality Capture 3D Laser Scanning
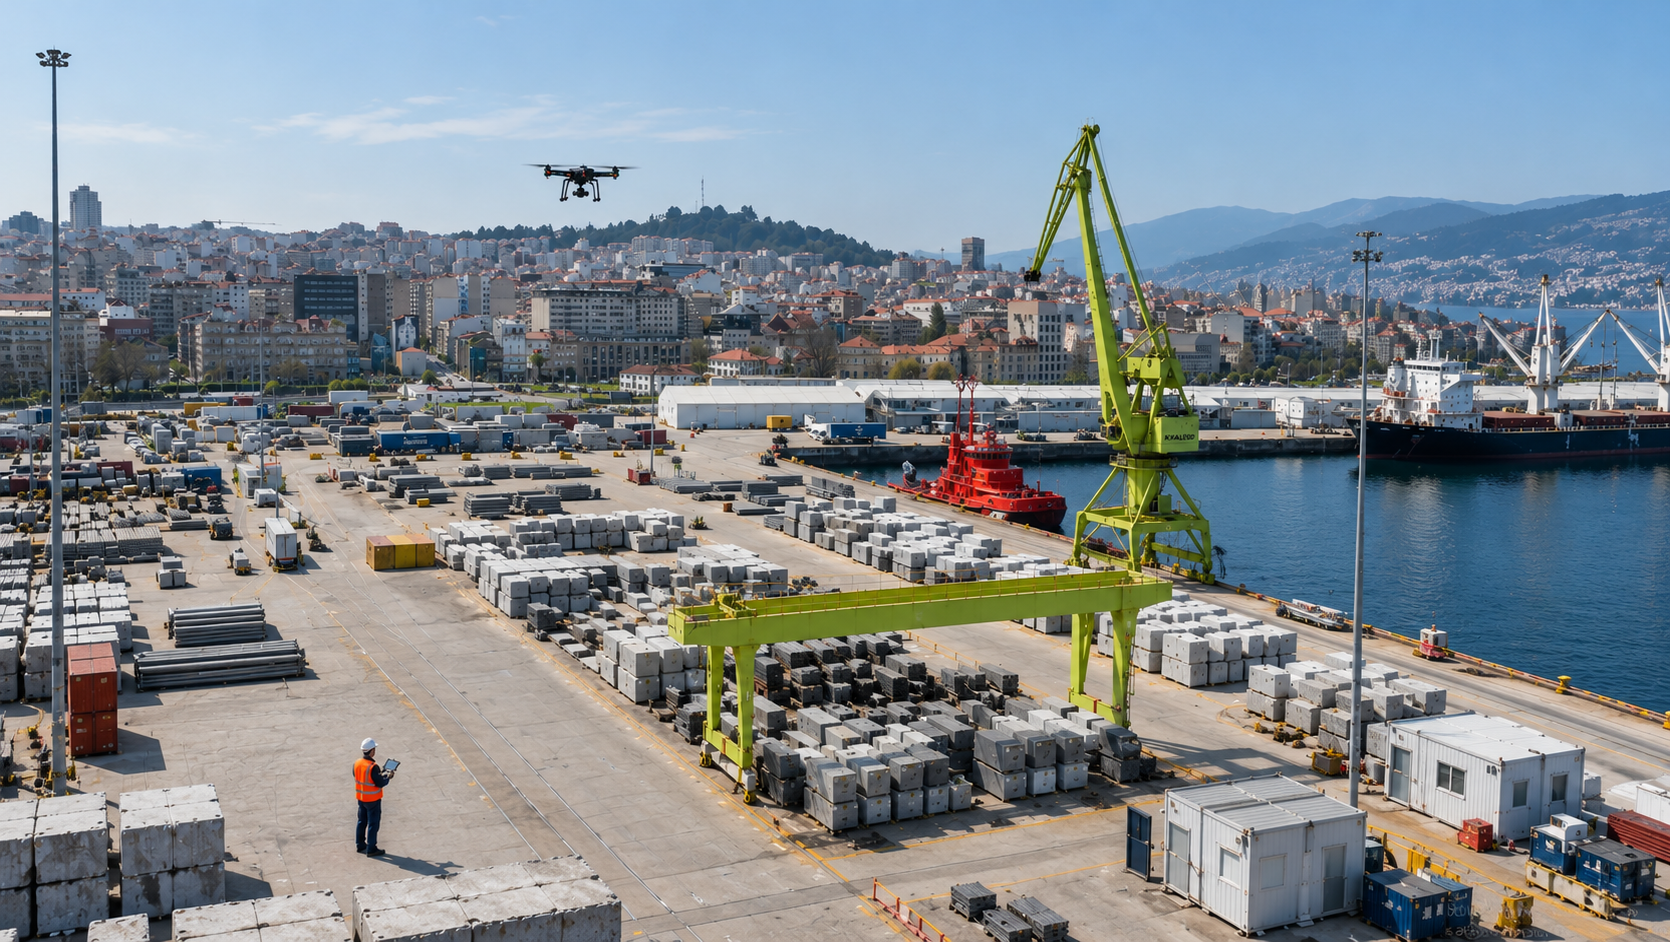
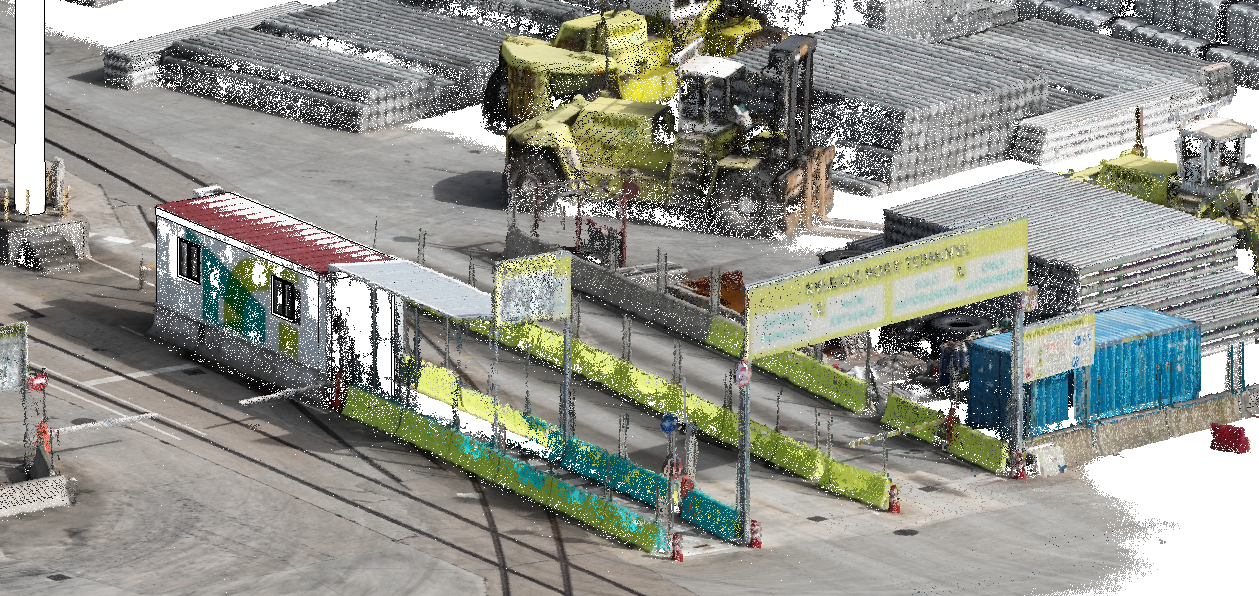
TWINPORTS begins with the capture of the real environment of the Port of Vigo using aerial imagery and LiDAR data.
This first stage provides a visual and geometric basis of the port area, which is then used to identify, locate and analyze the materials present.
The captured information becomes the starting point for the following stages of classification, geographic contextualization and integration into the digital twin.
BIM Modeling
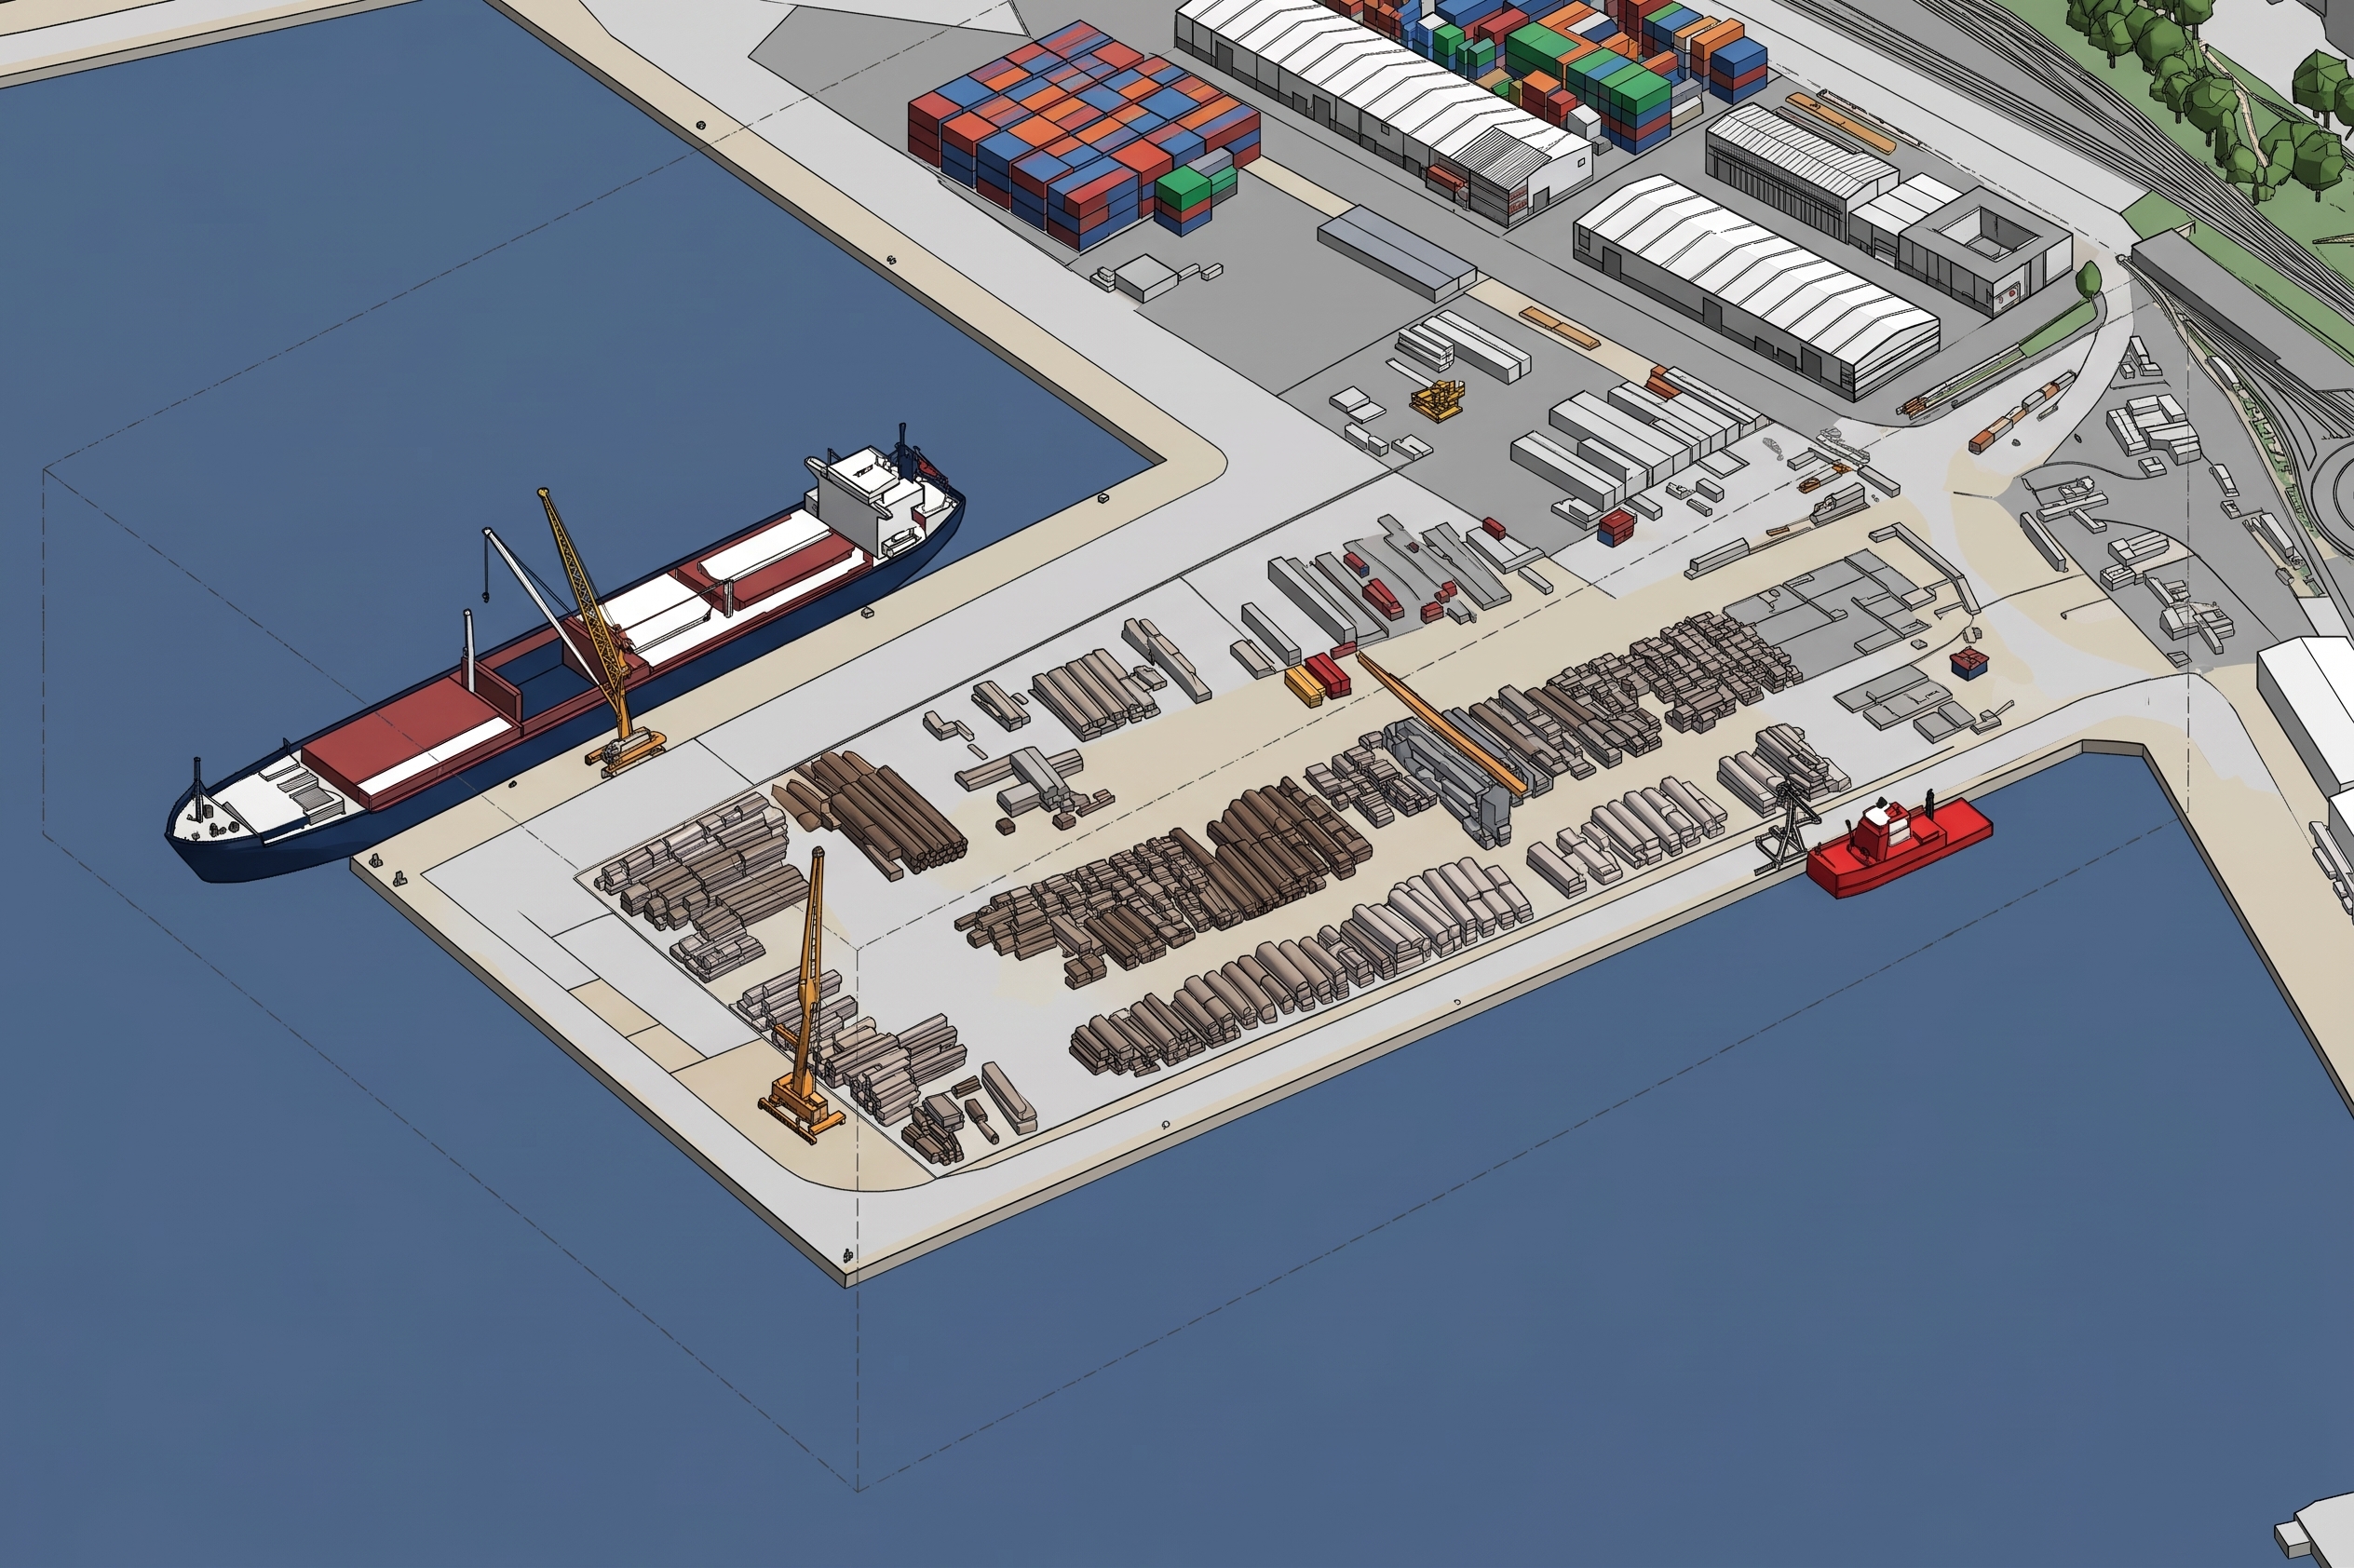
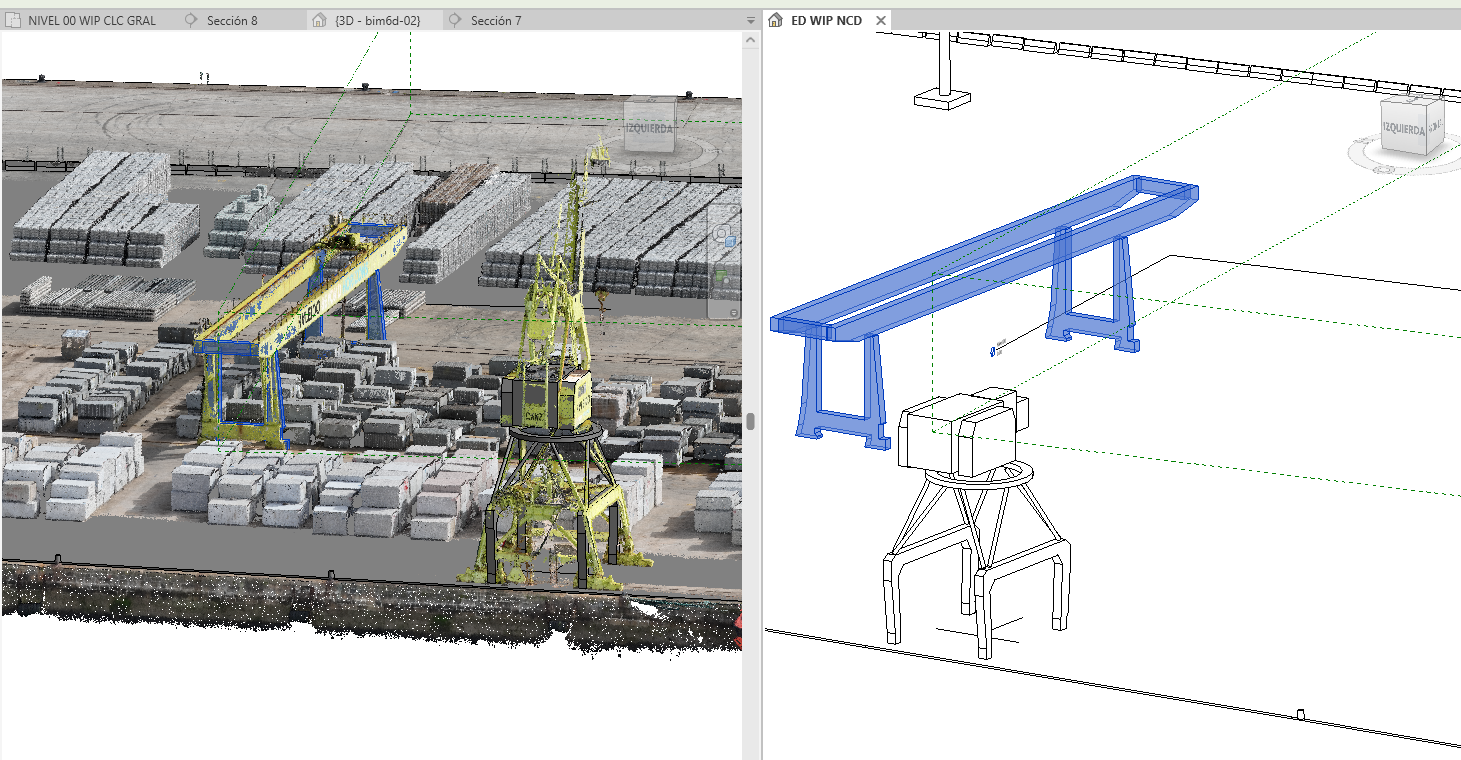
Using aerial imagery, LiDAR data and geospatial information, TWINPORTS creates a structured digital representation of the Port of Vigo, making it possible to identify, locate and analyze materials across its storage areas.
Main characteristics:
- 3D representation of the port environment
- Integration of LiDAR and geospatial data
- Identification and location of stored materials
- AI-based material classification
- Spatial organization of storage areas
- Visualization of material distribution
- Integration of the resulting information into the operational digital twin
The resulting digital environment provides a clearer understanding of how materials are distributed across the port and supports their monitoring, verification and management over time.
OPERATIONAL DATA AND DIGITAL TWIN INTEGRATION
TWINPORTS goes beyond creating a digital representation of the port. Its value lies in making operational information accessible, understandable and useful for day-to-day management.
By providing a clearer picture of stored materials and how their distribution changes, the project helps reduce uncertainty, improve coordination and support more informed decisions.
The result is a more connected approach to port management, where information becomes a practical resource for operational planning, supervision and continuous improvement.