BIM DATA MANAGEMENT WITH POWER BI
Year: 2017 | BIM6D
VIDEO: WORKFLOW
Interactive chart generation on the cloud for BIM database and processes, in real time that serve to evaluate and justify compliance with the BIM Level Of Information (LOI)
Within an integrated BIM project different disciplines, responsabilities and tasks are involved, all of them can be clasified in the so-called BIM DIMENSIONS. Behind all the work we must never forget that there are professional persons, who invest a very valuable time for the success of the project:
Within the BIM Management discipline, we highlight the importance of managing processes that are developed in a BIM project. But it is even more important to justify the work done and to be able to visualize it in a direct and easy way, instead the project size and complexity.
We show the BIM development process in an open and structured way, in real time
We evaluate the project evolution according to BIM uses, which we organize by dimensions, we show it in real time and through interactive graphs. The client and project participants can check the resources involved at any time and location, with different types of filtering and visualization. This real-time process management is integrated into our BIM Management CDE platform so that this information is common and collaborative.
BIM DATABASE CHART
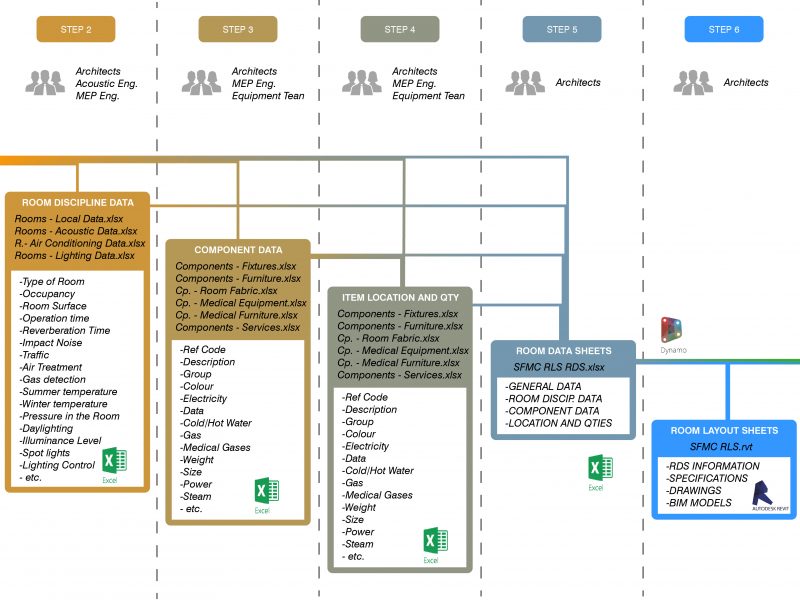
It’s even more important to be able to manage the I of BIM, in other words, the entire database contained in the models, in a direct and efficient way. For this, there are many applications based on the 4th and 5th dimensions that are necessary to develop the project planning and bill of quantities for construction process, and others that serve to manage the functional spaces, the equipment and furniture, the systems behavior, etc. very relevant for facility management uses. The problem is that almost all of them evaluate time frozen of a project, without time enough to evaluate, compare them, and draw conclusions to improve the design.
In BIM6D, we’re developing a real time platform linked with the BIM database. This information can be of any type: component quantities configured as needed, as well as the component specifications for any discipline, spaces and systems. Everything is real-time and interactive. In this data visualization platform we can configure rules or calculations to determine if the requirements or local regulations of the project are fulfilled.
For example, we can determine if the computed area for the project it’s within the requeriments, we can show in red those spaces that do not comply. Or we can show if the calculated daylight levels from a simulation meets the regulatory requirements that depend on the use of each space.
In BIM6D we use the interactive data visualization system to check the project compliance with the LOI ( Level of Information ) of the project and its components, among other tasks. We are convinced that the information contained in a BIM model, as a project evolves, becomes much more relevant than geometric information. Being aware that both are necessary for project comprehension and its behavior. Geometry and information are linked but in an asymmetric way in favor of information, no doubt.